• Skip to secondary menu
  • Skip to main content
  • Skip to primary sidebar

Eat Out Eat Well

  • Home
  • About
  • Eats and More® Store
  • Books
  • Contact

food facts

How You Eat Your Oreo Says Something About You

April 12, 2011 By Penny Klatell, PhD, RN 10 Comments

Oh, Oreos!  We must love them because we eat 20.5 million of them a day.

Over 491 billion Oreo cookies have been sold since they were first introduced on April 2,1912, making them the best selling cookie of the 20th century.

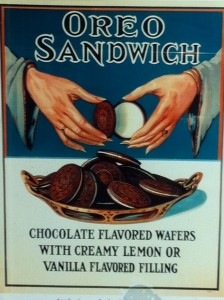
They were first baked at the National Biscuit Company (Nabisco) factory, which dates from the 1890’s, that runs from 15th to 16th Street between Ninth and Tenth Avenues in New York City.  Now called Chelsea Market, it is a bustling office and food complex.  This photo is of an Oreo label that is showcased in the main lobby.


The Original Oreo

Nabisco’s new idea for a cookie was two chocolate disks with a creme filling in between. Early Oreos looked a lot like today’s Oreo with just a slight difference in the design on the chocolate disks.

Originally they came with either a lemon or vanilla creme filling. In the US they cost 25 cents a pound and were sold in cans with glass tops so customers could see the cookies. The vanilla creme filling was more popular and production of the lemon filling was discontinued in the 1920s.

Today they come with a whole bunch of different fillings like mint, chocolate, caramel; double stuffs; chocolate coatings; and colored holiday fillings.

Oreos weren’t the first sandwich type cookies on the market. Sunshine introduced Hydrox in 1910 two full years before Oreo’s debut. But it seems that Sunshine fell short in its marketing because Hydrox never became as popular as Oreo and production stopped in the mid 1990s.

Oreos:  An Interactive Food

One of the keys to Oreo’s success is its interactivity.  Think about it – you don’t just eat it — you can dunk it, bite it, or twist it apart.  Oreo lovers, psychologists, and food writers have all speculated about whether the way someone eats their Oreo indicates a personality type.

According to a History.com video, in 2004, Kraft (Nabisco is now a Kraft brand), surveyed over 2000 Oreo eaters and found that they are divided into three categories:

  • Dunkers tend to be energetic, adventurous, and extremely social. 87% of dunkers say milk is their liquid of choice for dunking.
  • Twisters — and who hasn’t twisted an Oreo – (I personally think it makes the Oreo last longer ‘cause you get two cookies) – tend to be emotional, sensitive, artistic, and trendy.
  • Biters are easy going, self-confident, and optimistic.

The survey also discovered that more women tend to be dunkers while men tend to be biters.  And, Democrats tend to twist, Republicans tend to dunk!


Some Stats

A serving of regular Oreos, 34 grams, has 160 calories, 7g of fat (2 saturated), 25g carbs, 1g protein,1g fiber, and160mg sodium.

According to the Nabisco label, there are about 15 servings in an 18 oz. bag. After checking lots of sites, the general consensus is that there are around 3 cookies in a 34 gram serving.  It sure would be nice if Nabisco would give us the stats per cookie rather than for 34 grams so the consumer could have more useable information!

 

Filed Under: Food for Fun and Thought, Shopping, Cooking, Baking, Snacking, Noshing, Tasting Tagged With: calories, cookies, food facts, food for fun and thought, nutrition label, oreo cookie, snacks

A Primer On Reduced, Low, Light, And Free!

April 7, 2011 By Penny Klatell, PhD, RN Leave a Comment

Do you have a clue what the difference is between reduced fat, low fat, light, and fat free.  You practically have to walk around with a cheat sheet — or an app — to figure out if something actually lives up to the promise on the product’s label.

The same thing is true on menus, in deli cases, and the little labels perched next to the choices in salad bars.  Are the calories in the low calorie tuna salad less than the calories in the reduced calorie?  Can you even believe those calligraphied labels behind the glass cases?


Checking The List Of Ingredients May Or May Not Help

Packaged food labels list ingredients in descending order by weight, not amount. The first ingredient listed has the greatest amount by weight, the last ingredient is the one with the least amount by weight. That’s why preservatives are usually at the end of the ingredients list.  A ton of chemicals are not necessary to increase shelf life — a little bit will do it.  However, fat, sugar, and grains have more heft and usually are closer to the beginning of the ingredients list.


Fatty Labels

Labels have to include the total amount of fat, saturated fat and unsaturated fat.  This carves the way for the low, reduced, and fat free categories.

  • Low fat means 3 grams of fat or less per serving (or per 100 grams of food)
  • Reduced fat means the food product contains 50% (or less) of the fat found in the regular version
  • Less fat means 25% or less fat than the comparison food
  • Fat free means the product has less than 0.5 grams of fat per serving, with no added fat or oil

Salty Labels

  • Reduced sodium means at least 75% less sodium
  • Low sodium means 140 milligrams of sodium or less per serving
  • Very low sodium means 35 milligrams of sodium or less per serving
  • Sodium free (salt free) means there is less than 5 milligrams of sodium per serving

Sweet Labels

  • Sugar free means there is less than 0.5 gram of sugar per serving
  • No sugar added means there’s no table sugar added but there may be other forms of sugar like dextrose, fructose, glucose, sucrose, maltose, or corn syrup

The Low down On Low, Light (Lite), Lean, and Reduced

  • Reduced calorie on the label means there’s at least 25% fewer calories per serving than in the regular (full calorie) version of the product
  • Low calorie means 40 calories or less per serving and less than 0.4 calories per gram of food
  • Light (fat) means 50% or less of the fat than in the regular, full calorie, version
  • Light (calories) means 1/3 fewer calories than the regular, full calorie, version
  • Lean (meat, poultry or seafood) means less than 10 grams of fat, 4.5 grams of saturated fat, and 95 mg of cholesterol in a 100 gram serving
  • Extra lean (meat, poultry or seafood) means less than 5 grams of fat, 2 grams of saturated fat, and 95 mg of cholesterol in a 100 gram serving

Confused???

Confused by the ins and outs of labeling?  You’re not alone.  Try to be as savvy as possible and do a little investigating. A product sporting a reduced fat label  just means that it contains at least 25% less fat than the original version. Unfortunately, this doesn’t necessarily mean that it ends up being a low fat product. Take a reduced fat muffin. If the fat content in the original full fat muffin is 30g and the fat has been reduced to 15g — a 50% reduction which allows it to say it is reduced fat — the reduced fat muffin still has a fat content five times higher than the 3g of fat per serving that officially qualifies as low fat.  Check the calorie count and fat breakdown on the nutrition label for more complete info.  

Filed Under: Calorie Tips, Healthy Eating, Food Facts, Manage Your Weight, Shopping, Cooking, Baking Tagged With: calorie tips, extra lean, fat, fat free, food, food facts, food shopping, ingredients label, lean, light, low fat, nutrition label, reduced fat, weight management strategies

Some Vegetables (some green) Have Protein, Too!

April 5, 2011 By Penny Klatell, PhD, RN Leave a Comment

Are you thinking about eating more vegetables and less meat but worry about getting enough protein?

Of course you can always get protein from excellent non-meat sources like eggs, fish, nuts and seeds, certain grains, and low or non fat dairy products.  But what about vegetables?

Beans and Legumes

Many people are aware that beans can be good protein sources.

For example, here’s the number of grams of protein in one cup of:

  • Cooked soybeans, 29 grams
  • Cooked lentils, 18 grams
  • Cooked black beans, 15 grams
  • Cooked kidney beans, 13, grams
  • Cooked chickpeas, 12 grams
  • Cooked pinto beans, 12 grams
  • Cooked black-eyed peas, 11 grams

What About Other Veggies?

Here’s the number of grams of protein for one cup of each of these vegetables:

  • Cooked lima beans, 10 grams
  • Cooked peas, 9 grams
  • Cooked spinach, 5 grams
  • Cooked broccoli, 4 grams
  • One medium potato, 4 grams

This Is Not A Complete List

There are other vegetable sources of protein, too.  These are just examples of some of the more common veggies that can serve as protein sources.  For a more complete list you can always check the USDA’s data base.

Spinach On Your Sandwich

For upping your protein – especially in a meatless meal – try adding some raw spinach instead of lettuce on your sandwich.  How about broccoli slaw instead of cole slaw, or peas mixed with your pasta?  Sounds good to me!


Filed Under: Calorie Tips, Healthy Eating, Food Facts, Manage Your Weight, Shopping, Cooking, Baking Tagged With: beans, broccoli, calorie tips, food facts, protein, spinach, vegetables, weight management strategies

Sweet! It’s Spring And Maple Sugar Time

March 31, 2011 By Penny Klatell, PhD, RN Leave a Comment

Americans tend to like sweet stuff and most of us eat more of it than we should.

Although we’re warned to be conscious of the amount of sugar we eat, that doesn’t mean never eat anything sweet.  Of course, some people choose not to, but if you do – eat the good stuff – like real maple syrup.


Who Made Maple Syrup First?

Maple trees are tapped in early Spring for the sap used to make syrup. The sap is a clear, watery liquid which is boiled down to concentrate it into syrup.

Native Indians in the US and Canada were probably the first producers of maple products. They would make gashes in the trees, collect the sap, let it partially freeze to enrich it, then reduce it by heating, sometimes by dropping heated stones into the collected sap.


Ideal Conditions

This year’s harsh winter created great conditions for an incredible maple syrup season. The below freezing nights and above freezing days were ideal and nearly doubled production at some sugar shacks, especially for light grades of syrup.

The syrup color generally depends on the time of the season the sap is collected.  Lighter syrup tastes cleaner and more sugary and usually results from colder temperatures earlier in the season. Dark syrup has a different sugar content, a taste that lingers in your mouth, and usually comes from sap collected later in the season.


Some Maple Sugaring Facts

According to the Stamford Museum and Nature Center (CT):

  • About 40 gallons maple sap are needed to make 1 gallon of maple syrup
  • Fresh sap is 2% sugar; maple syrup is 67% sugar
  • A tree must be at least 10 inches in diameter before it can be tapped; each taphole averages 10 gallons of sap a season
  • A sugar maple takes about 40 years to reach 10″ in diameter and there is no permanent damage if only 10% of its sap is collected annually
  • In the US, Vermont is the largest syrup producer, Maine is second, New York is third
  • In 2006 the US produced 1,449,000 gallons of maple syrup — Canada produced over 7 million
  • Maple syrup has 40 calories a tablespoon; corn syrup has 60


What’s The Difference Between Real Maple Syrup And Commercial Pancake Syrups?

The sticky stuff, often called pancake syrup, that you likely find in your local diner and in the Aunt Jemima and Mrs. Butterworth’s bottles on your supermarket shelves is not considered “real” maple syrup. That’s because it’s not made from maple sap  but rather from a mixture of corn syrup, high fructose corn syrup,  and a chemical soup of colorings, flavors, and preservatives.

Real maple syrup is graded.  In the US (Canada has different grading) the grading is:

  • Grade A Light Amber:  light amber color, light and mild maple flavor
  • Grade A Medium Amber: medium amber color, a bit more maple flavor, the most popular grade for table use
  • Grade A Dark Amber: dark amber color, strong maple flavor
  • Grade B: dark color, usually used for cooking and baking


Filed Under: Food for Fun and Thought, Shopping, Cooking, Baking, Snacking, Noshing, Tasting Tagged With: food facts, food for fun and thought, maple syrup, sugar, sweet

A Healthy Eating Lesson On The Subway

March 15, 2011 By Penny Klatell, PhD, RN Leave a Comment

New York city, uptown #2 train, Saturday night.  Not too crowded, most people are wearing their subway stares – avoiding eye contact, eyes glazed over, ipod earbuds in place, bodies rocking with the motion of the train.  My trip isn’t long enough to pull out something to read, so I start to scan the ads that run above the seats– something I’ve entertained myself with since I was a little kid.

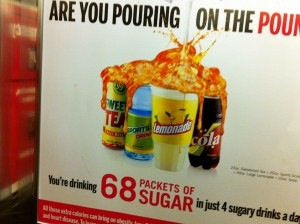
One whole side of the subway car I was in was filled with posters for New York City’s “Are You Pouring On The Pounds” campaign — aimed at teaching people to reduce their sugar intake (and lose or keep off weight) by cutting down on sugary drinks. It also encourages New Yorkers to drink water, seltzer or low-fat milk instead of the sweet stuff.

The posters are filled with liquid pouring out of bottles of soda, “sports” drinks or sweetened iced tea and turning into blobs of fat as it reaches the glass. Large graphics leave you with no doubt about the number of teaspoons or packets of sugar in each drink — or the total amount of liquid sugar that you could drink daily – as shown in the photo above.

For example: a 20 ounce bottle of soda is equivalent to 16 packets of sugar and a 32 ounce gigantic size cup – the kind so popular in movie theaters, gas stations, and arenas — contains the equivalent of 26 packets of sugar.

Do You Forget To Count The Calories You Drink?

It’s hard to overeat without noticing it. But, many people who gain weight — and can’t figure out why — forget to include the calories in what they drink.  Sugary drinks can add hundreds of calories and they don’t even make you feel full.

On average, Americans now consume 200 to 300 more calories each day than 30 years ago, with nearly half of those calories coming from sugar-sweetened drinks. A survey of adult New Yorkers shows that more than 2 million drink at least one sugar sweetened soda or other sweetened beverage each day – often at 250 calories a pop. Teenagers who drink sugary beverages get an average of 360 calories from them each day.  (They’d have to walk 70 city blocks to use up that many calories.)

Some Facts

A teaspoon of sugar weighs about four grams and each gram of sugar has four calories – or about 16 calories per teaspoon of sugar. On average, Americans consume about 22 teaspoons of added sugar a day – the equivalent of around 350 calories.  (Added sugar refers to the extra, empty calorie, added sweeteners, not the sugar that naturally occurs in foods like fruit and milk.)

The quickest way to decrease some of that sugar is to cut down on soda and sweetened drinks.   Sugary drinks, including sweetened tea or sweetened water that claims to be healthy, account for about one-third of added sugars.

Eating large quantities of sugar can lead to obesity and health problems like diabetes and heart disease. The American Heart Association recommends a daily max of six teaspoons of added sugar for women and nine teaspoons for men.  That’s quite a bit less than 22 teaspoons Americans generally average.  Too many spoonfuls of sugar may create the need for medicine rather than making it easily go down!

Filed Under: Calorie Tips, Healthy Eating, Food Facts, Manage Your Weight, Shopping, Cooking, Baking, Snacking, Noshing, Tasting, Takeout, Prepared Food, Junk Food, Travel, On Vacation, In the Car Tagged With: added sugar, calorie tips, calories, food facts, obesity, pounds, soda, subway, sugar, sugary drinks, weight, weight management strategies

  • « Go to Previous Page
  • Go to page 1
  • Interim pages omitted …
  • Go to page 22
  • Go to page 23
  • Go to page 24
  • Go to page 25
  • Go to page 26
  • Interim pages omitted …
  • Go to page 37
  • Go to Next Page »

Primary Sidebar

Recent Posts

  • Buy Me Some Peanuts And Cracker Jacks
  • Is Your Coffee Or Tea Giving You A Pot Belly?
  • PEEPS: Do You Love Them or Hate Them?
  • JellyBeans!!!
  • Why Is Irish Soda Bread Called Soda Bread or Farl or Spotted Dog?

Topics

  • Calorie Tips, Healthy Eating, Food Facts
  • Eating on the Job
  • Eating with Family and Friends
  • Entertaining, Buffets, Parties, Events
  • Food for Fun and Thought
  • Holidays
  • Lose 5 Pounds in 5 Weeks
  • Manage Your Weight
  • Restaurants, Diners, Fast Food
  • Shopping, Cooking, Baking
  • Snacking, Noshing, Tasting
  • Takeout, Prepared Food, Junk Food
  • Travel, On Vacation, In the Car
  • Uncategorized

My posts may contain affiliate links. If you buy something through one of the links you won’t pay a penny more but I’ll receive a small commission, which will help me buy more products to test and then write about. I do not get compensated for reviews. Click here for more info.

The material on this site is not to be construed as professional health care advice and is intended to be used for informational purposes only.
Copyright © 2024 · Eat Out Eat Well®️. All Rights Reserved.